New Ways to See the Research
Experiments with data visualization can showcase patterns of segregation, marginalization, and discrimination.
An Interactive Experience
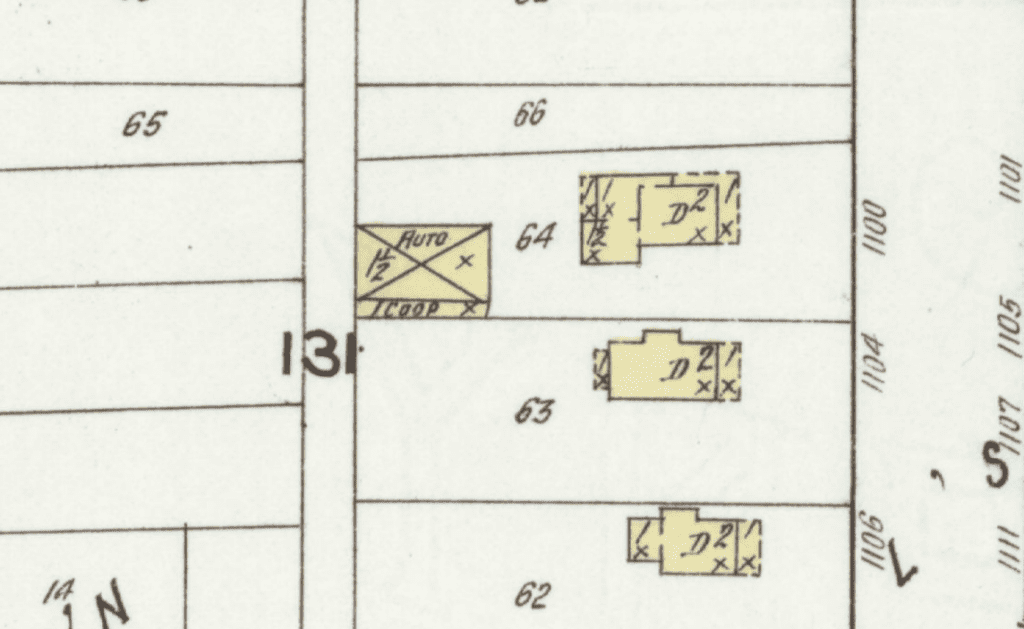
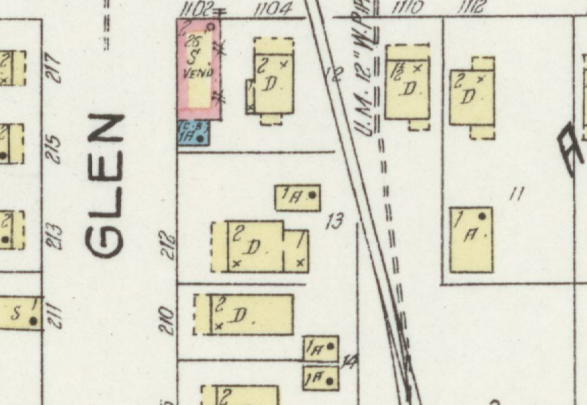
After identifying places where African American students lived on campus, Bentley researchers worked with University of Michigan Visualization Librarian Justin Joque and his team to integrate the collected information with a 1930 Sanborn Insurance map of Ann Arbor overlaid on a large regional map. U-M’s Inclusive History Project supported updates to the visualizations.
African American U-M Student Residences
1853-1973 (approx)
Select a Time Range to Search
yearStart to yearEnd selected
Filter Data
Map Legend
This interactive map plots local addresses for African American students at the University of Michigan.

Information for Understanding the Map
This interactive map plots local addresses for African American students at the University of Michigan. Clusters identify housing concentrations. These concentrations reveal patterns of segregation. Boarding house options were limited for African American students, particularly prior to World War II. After World War II, African American students began to live in university-owned housing with greater regularity.
Some prominent addresses include the following.
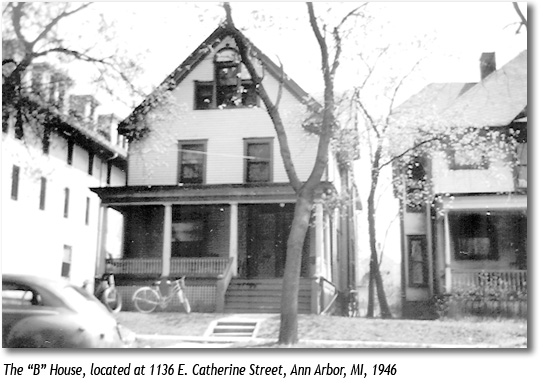
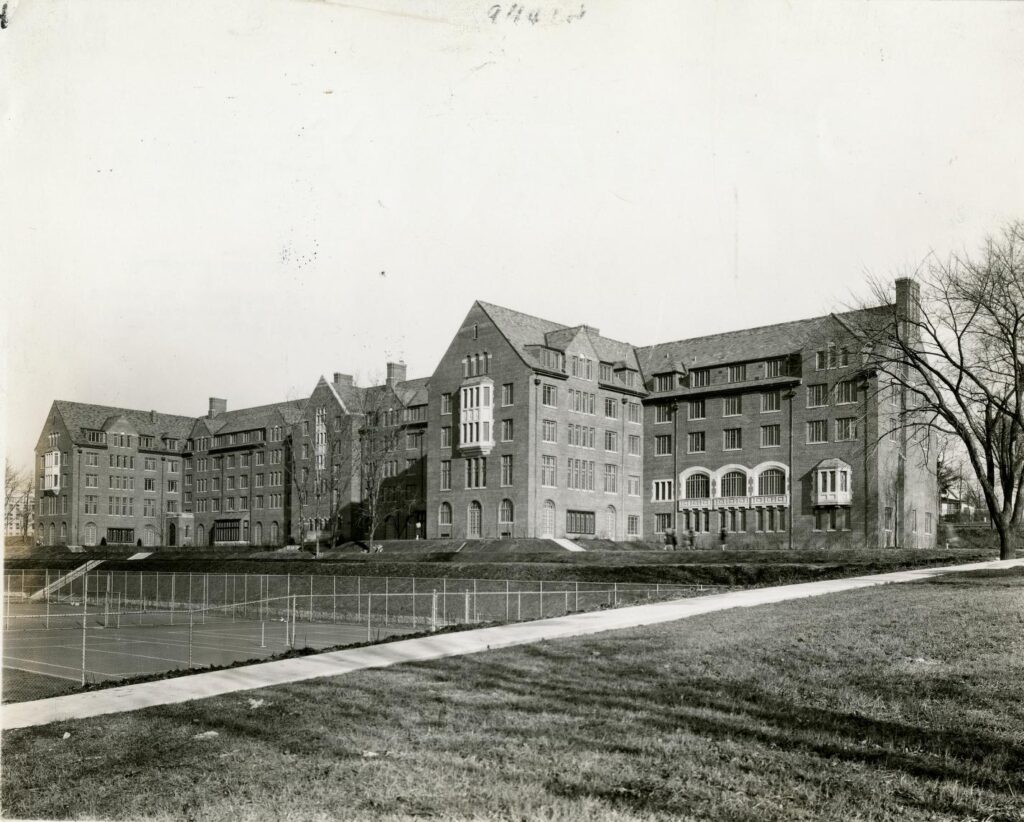
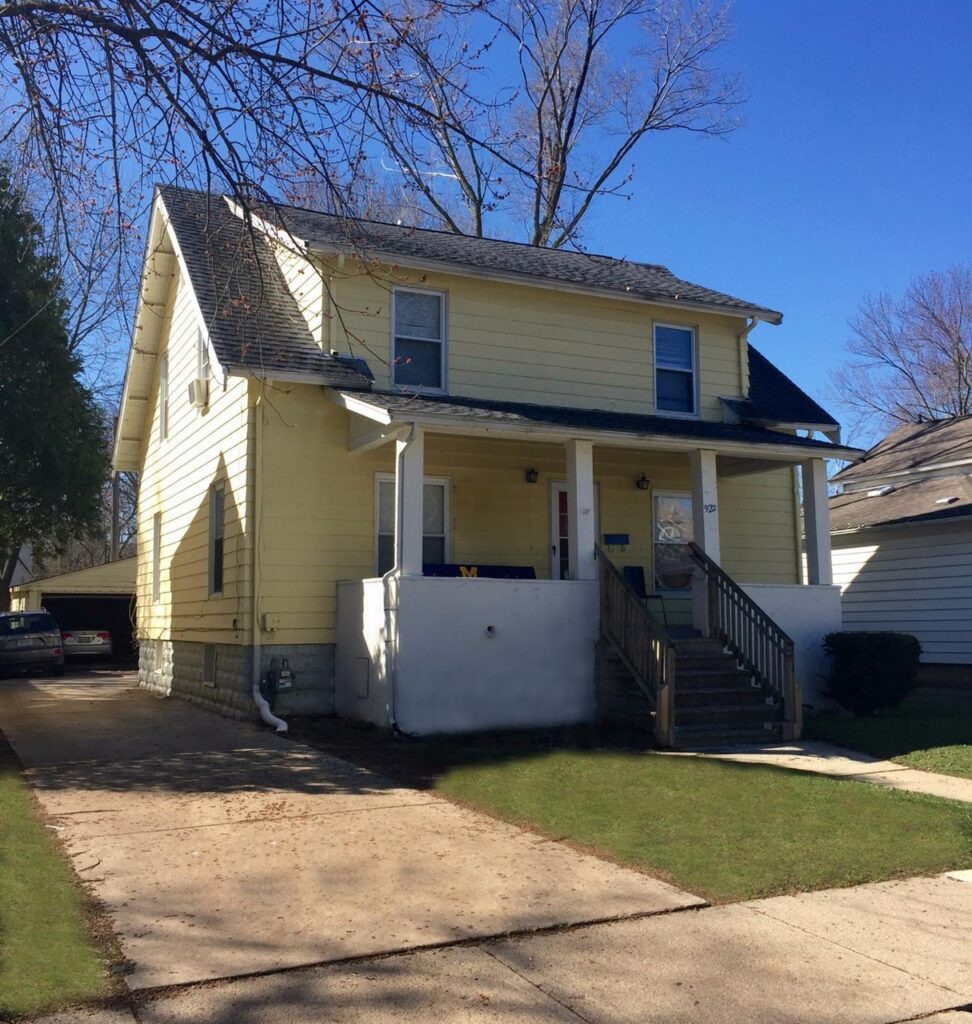
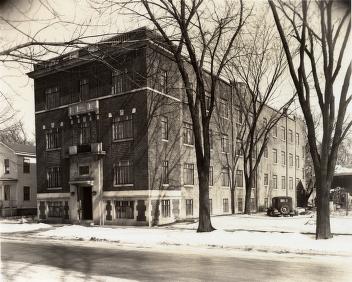
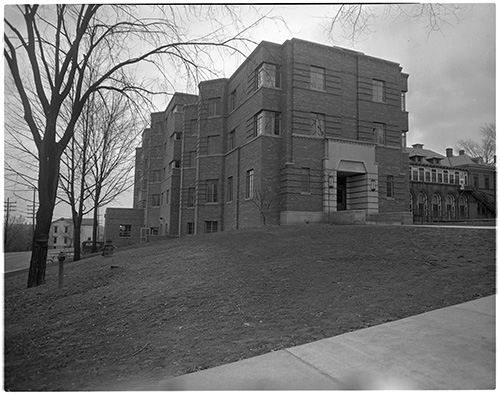
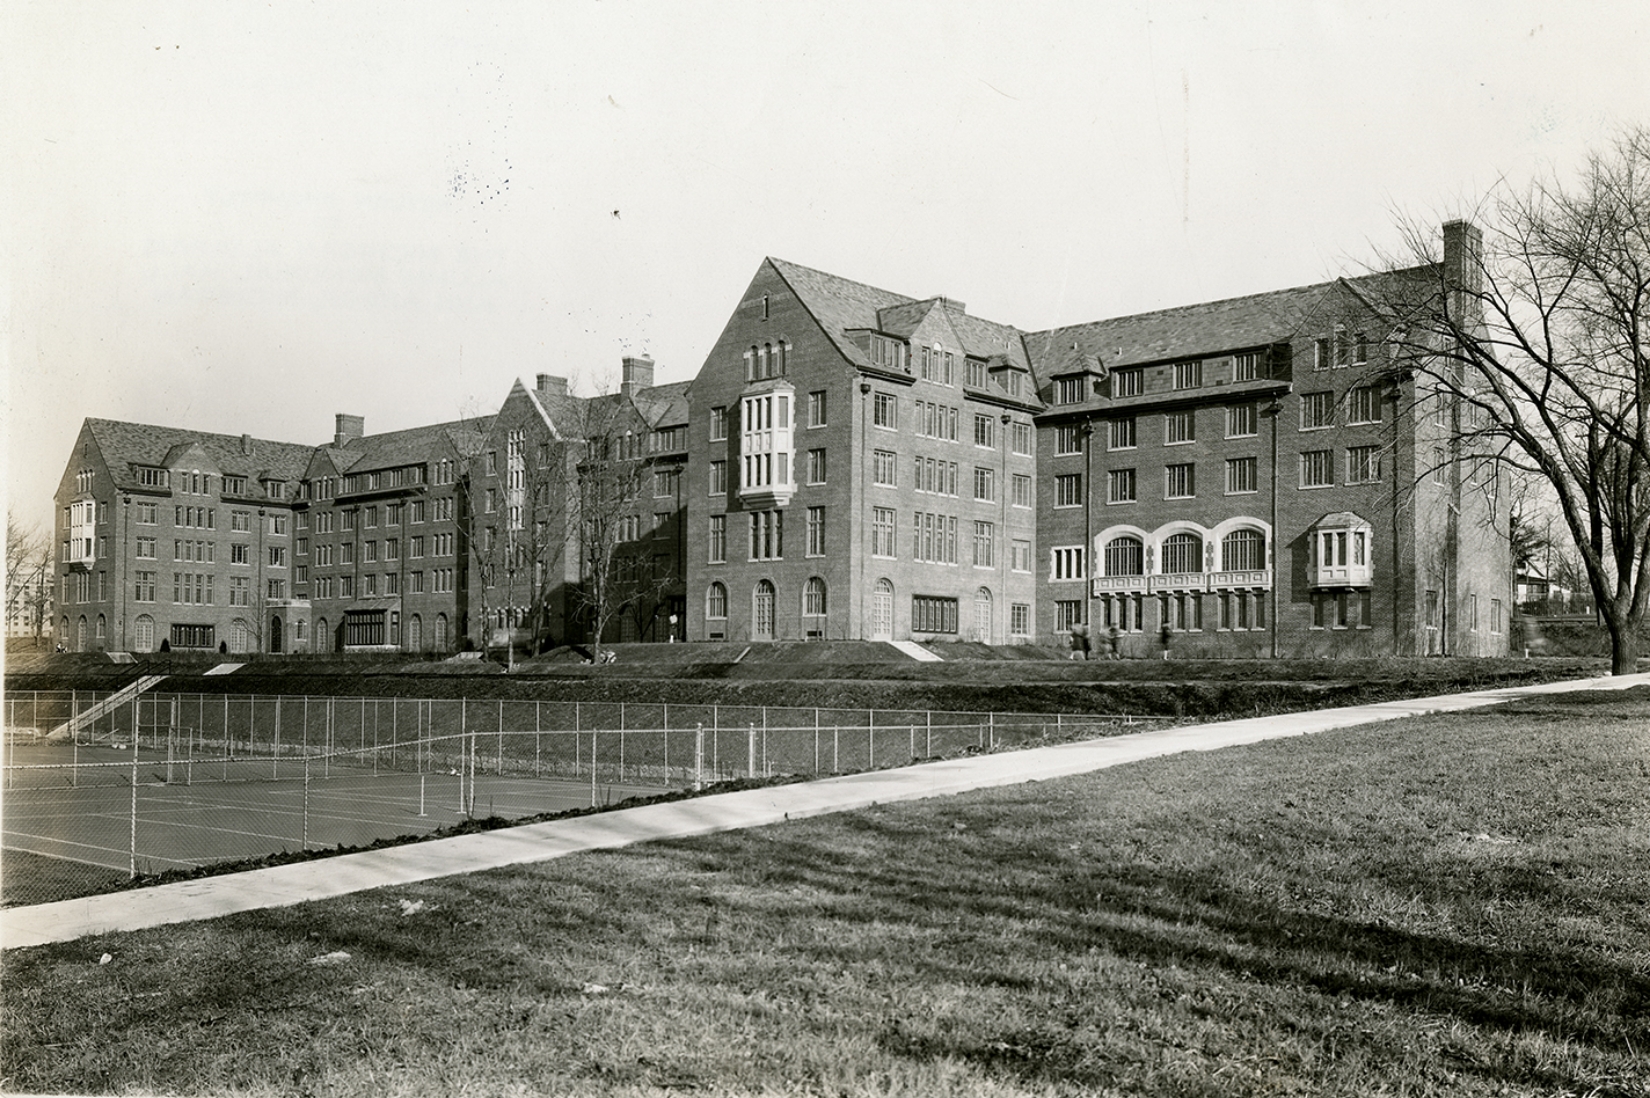
1102 East Ann. A house for African American women established by the university in 1929. It was managed by Alice Benjamin and was widely known as the Benjamin House or the B House. More than 300 students lived at the house until it was closed in 1945.
1136 East Catherine. The successor to 1102 East Ann Street, this house was run by Roberta Ellis Britt who herself was a graduate of the University and continued the tradition of the house serving as the social center of campus for Black women. For the decade between 1946 and 1956, more than 120 Black students lived there.
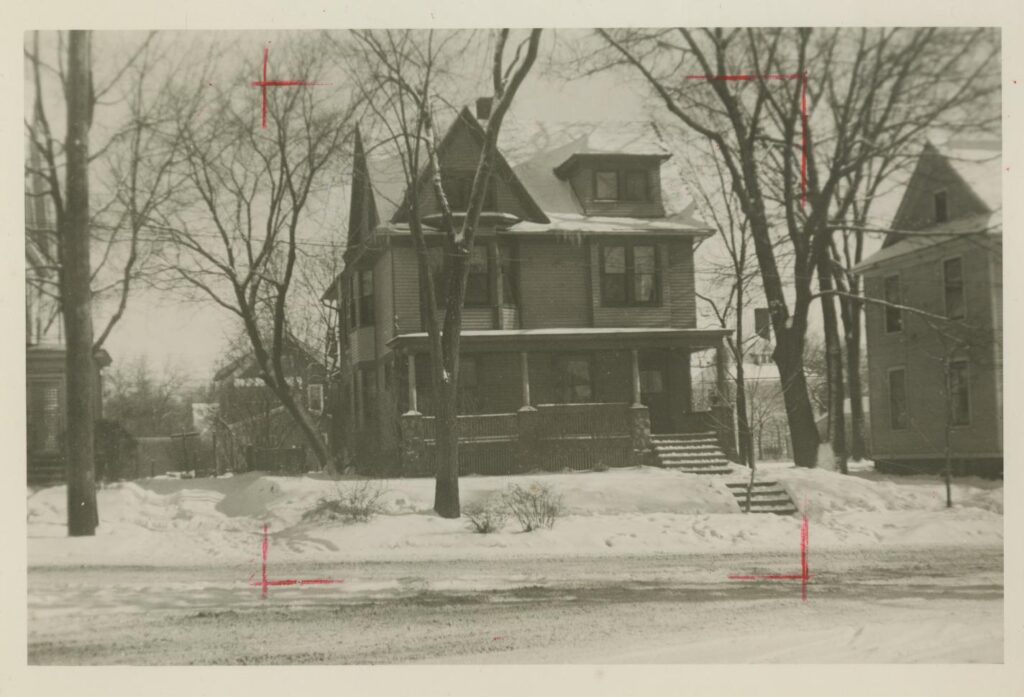
144 Hill. A boarding house owned by Esther Dickson. In 1921 it was the location of the probationary Phi chapter of Omega Psi Phi fraternity. Dickson primarily rented to male students, but briefly rented to women in the late 1920s. The address was listed as a tourist house in the 1948 edition of The Negro Motorist Green Book.

Event Locations of the Map
The blue markers on the map represent the location of events significant in the lives of Black women on campus. Locations represent sites of protest, or places where important events occurred. The dots are part of a tour “Walking in the Steps of Black Women: A History of the University of Michigan.” The tour was developed as part of a class project.

Tips for Using the Map
The sliding bar allows for focusing on a single year or range of years. Each bar in the graph represents a single academic year. Click a single bar to view data for one year. Drag the cursor over multiple bars to view data for a range of years.
Small Multiples Residents at Addresses
African American Student Home Town Locations
Select a Time Range to Search
yearStart to yearEnd selected
U-M Data Patterns
Additional ways to visualize and chart historical data about African American students on campus.
-
 View Data
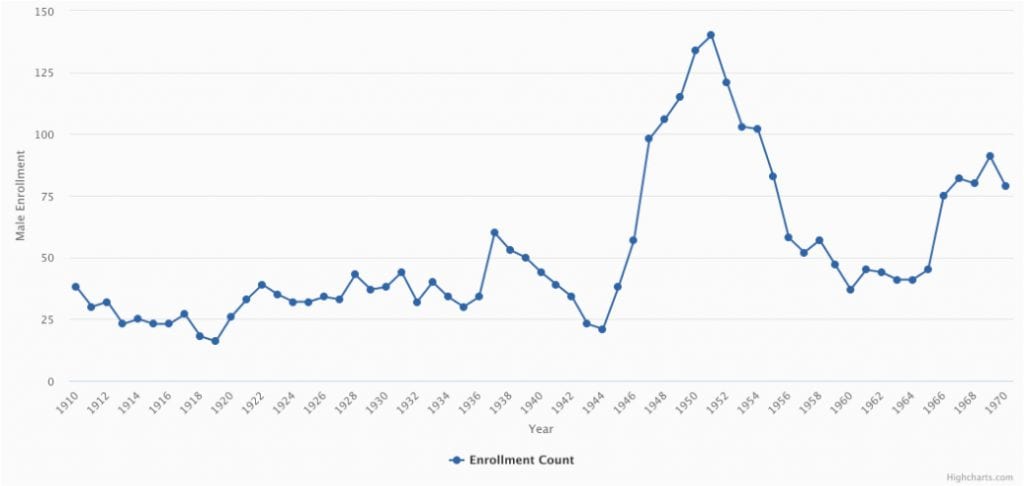
African American Male Student Enrollment by Year
From 1900 to 1934, the numbers fluctuated between 25-45 enrollees annually, with a significant dip during World War I. The sharp rise in the mid-1930s reflects the impact of “segregation scholarships” provided by southern states primarily to graduate students as a way to avoid integrating state schools or providing “separate but equal” in-state options. There is a slow decline during the Great Depression to a nadir at the end of World War II. The sharp increase beginning in 1945 may in part be a resurgence in “segregation scholarships,” but more importantly reflects returning WW II veterans and the impact of the GI Bill. The post-war surge peaks in 1950 and begins a fairly sharp decline.
-
 View Data
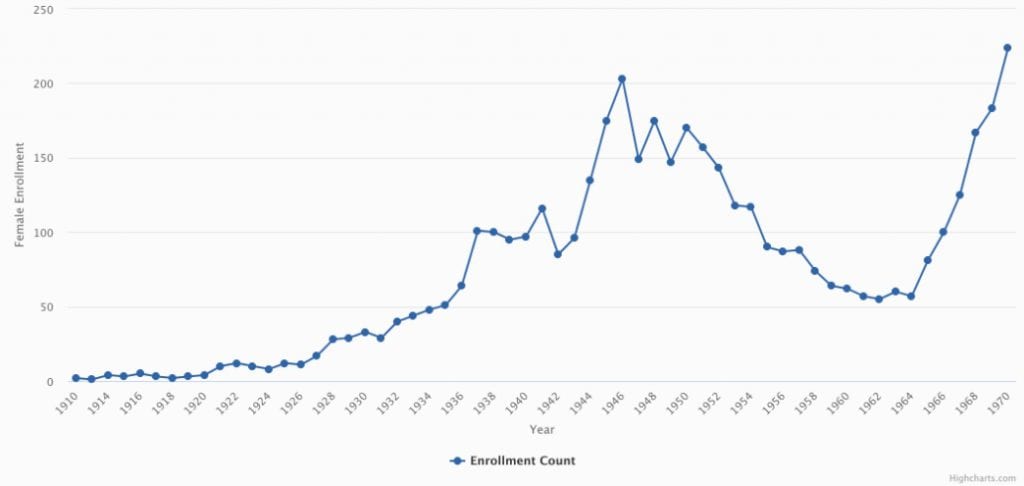
African American Female Student Enrollment by Year
Starting from very low numbers 1900-1920, there is a slow but steady increase through the mid-1930s. The sharp rise beginning in 1934 reflects the advent of “segregation scholarships.” The impact of the Great Depression does not seem as severe on female enrollment. WW II causes an initial drop, but then there is a surge for female enrollees from 1943-1945. The post-war rate of decline for women is significantly lower than for men.
-
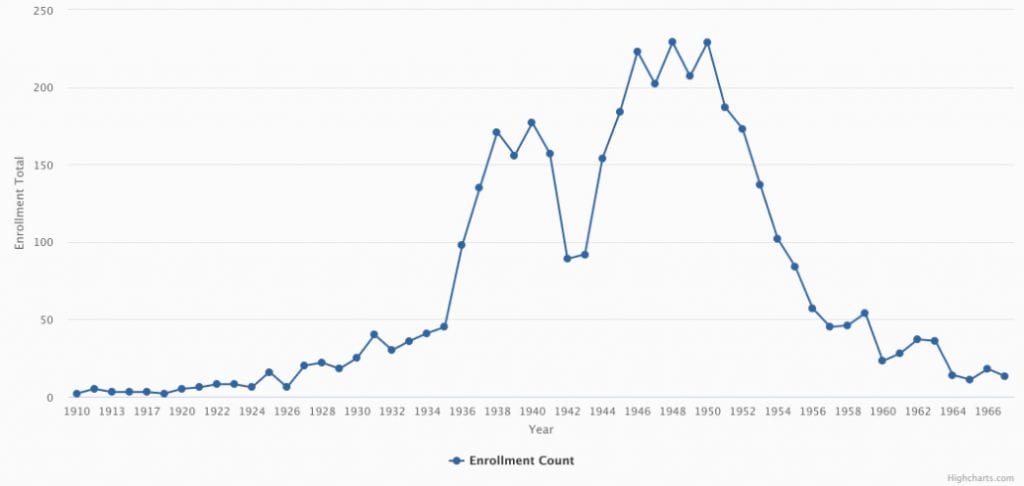 View Data
African American Summer Enrollment by Year – All Students
This displays total enrollment of all African American students in summer sessions, though the population skews heavily toward graduate students. The sharp increase beginning in 1935 reflects the advent of the “segregation scholarships.” After the decline during WW II, the rebound reflects a return to pre-war levels of “segregation scholarships” with some additional impact of the GI Bill. Part of the decline after the early 1950s may be attributable to the slow integration of graduate programs in some southern states.
You can also take a virtual tour of sites of importance for African American women at the University of Michigan. This was developed in conjunction with Michigan in the World in the Department of History.
